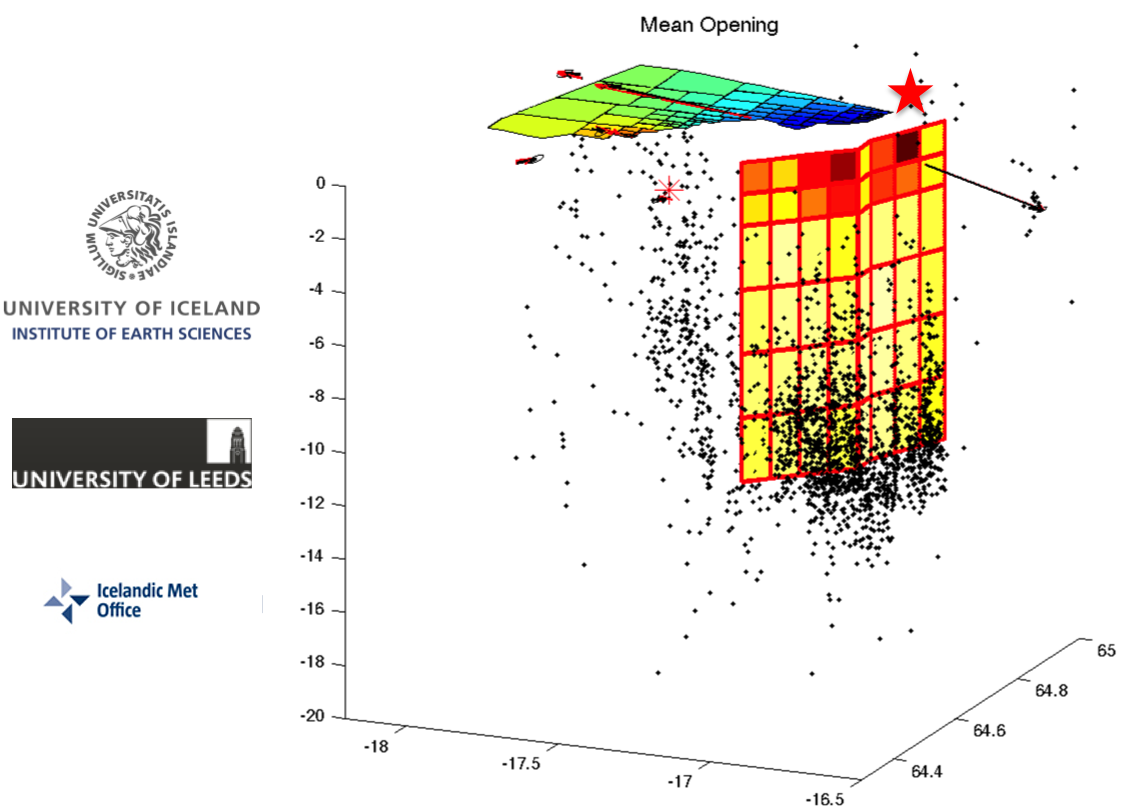

Model of surface deformation, incorporating both GPS and satellite data, spanning the period 10th August 2014 - 27th August 2014. The vertical plane represents the location of the dike at depth (red colours show maximum opening). The model indicates that the eruption (red star) is coming from the patch with maximum opening (5m), right at the surface (dark red patch). Black dots show earthquakes during the same time period (since the start of unrest on the 16th August 2014) located by the Icelandic Met Office. Model processed by A.J.H.
Interferogram processing carried out using CSK Products, © ASI (Italian Space Agency) - 2014, delivered under an ASI license to use. COSMO-SkyMed images have been provided in the framework of the Geohazard Supersite Initiative.
